
Do Geopolitical Oil Shocks Cause Equity Bear Markets?
- JASON TEH, Chief Investment Officer
- Apr 15
- 6 min read
In The Biggest Oil Shock in History. Why Isn't the Price Higher? we established that geopolitical oil shocks follow two distinct patterns. Before 1986, oil prices were administered by OPEC — when a shock struck, the cartel used it to permanently reprice oil upward, and the price never came back down. After 1986, when Saudi Arabia abandoned its role as swing price-setter and oil became freely traded, a different pattern emerged: the crude price spikes on fear, peaks within months, and reverts as the uncertainty resolves. Every geopolitical shock since 1986 has followed this shape without exception.

Source: Vertium, World Bank.Each line shows the oil price indexed to 1.0 at the trigger month. A reading of 2.0 means the price doubled; 0.5 means it halved. The x-axis shows months before and after, allowing each crisis to be compared on the same scale regardless of the absolute price level at the time.
But for equity investors, a second question matters just as much: do geopolitical oil price shocks cause equity bear markets? The S&P500 behaviour around geopolitical oil shocks tell a more complicated story.
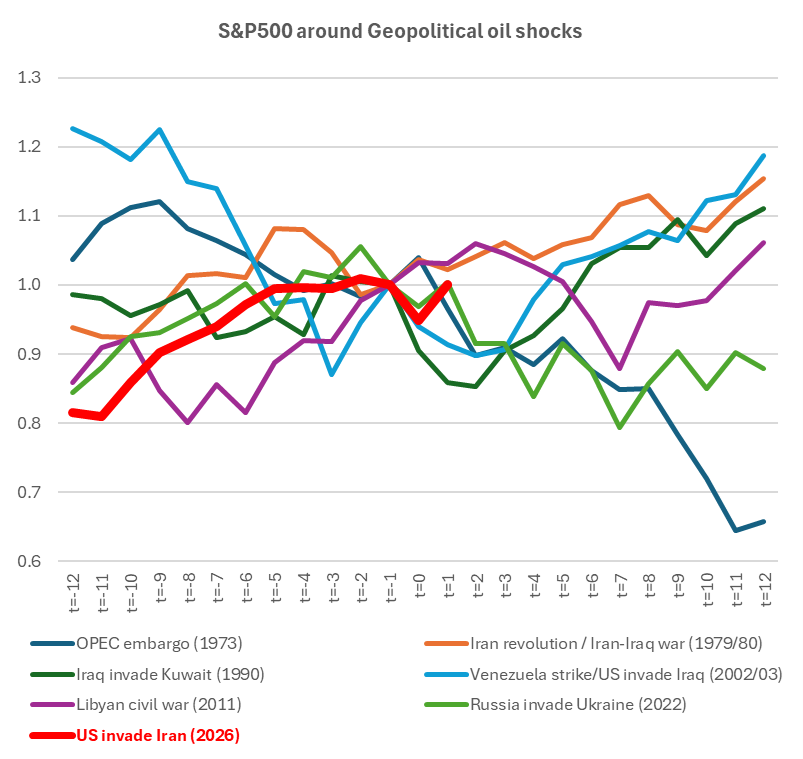
Source: Vertium, Iress. S&P 500 indexed to 1.0 at the trigger month for geopolitical event.
Unlike the oil chart — where every event produces a spike that eventually reverts — the equity market responses to geopolitical oil shocks are highly dispersed. The 1973 and 2022 events coincided with bear markets — drawdowns of 20 percent or more. The remaining events show that geopolitical oil shocks alone had remarkably little lasting impact on equities. The 1990 Gulf War produced a shallow dip that recovered within months. The 2003 Iraq invasion produced a rally. The 2011 Libya disruption barely registered. Setting aside the two outliers, geopolitical oil shocks look far less threatening to equity investors than the headlines imply.
What happens to equities depends on two things: the state of the economy when the shock arrives, and whether the index is dominated by sectors that oil is powerful enough to crush.
1974: A Recession Already Arriving
Ahead of the 1972 election, the US economy was running hot fuelled by loose US monetary policy and Nixon's fiscal stimulus. In response to the overheated economy the Federal Reserve raised the federal funds rate from 4.8 percent to 10.8 percent by September 1973 with inflation already running at 7.4%. By October, the ISM manufacturing index was already deteriorating from its January peak — signalling that corporate activity was weakening. The economy was already losing momentum well before the oil embargo shock arrived in October 1973. The US officially entered a recession one month later.
The severity of the damage was amplified by the composition of the index at the time. In 1973, the S&P 500 reflected a manufacturing economy. Industrials and materials — sectors whose earnings were heavily exposed to energy as a cost input represented a significant proportion of the index. When oil quadrupled, manufacturers, chemical companies, and consumer businesses that made up the bulk of the index were crushed by input cost inflation.
The oil shock did not start the recession. It struck an economy where corporate earnings were already under pressure — and then pushed it over the cliff. The quadrupling of oil prices turned what might have been a mild correction into a stagflationary catastrophe. The S&P 500 fell 48 percent from January 1973 to October 1974 — a 21-month bear market that ranked as the most severe postwar drawdown until the 2008 global financial crisis.
2022: A Technology Bear Market
The S&P 500 of 2022 was structurally unrecognisable from the 1973 index. Broader technology — spanning the Technology sector, Communication Services and Consumer Discretionary — represented around 40 percent of the index. The global economy had also shed much of its oil dependence. In 1973, at peak oil intensity, the world used nearly one barrel of oil to produce $1,000 of GDP. By 2022 that figure had fallen to less than half a barrel — a 56 percent decline driven by fuel efficiency improvements and the substitution of oil with other energy sources. The same price spike that devastated the industrial-heavy index of 1973 was always going to have a much more limited direct impact on an index dominated by software and semiconductors.
In 2022, the earnings softness of large technology companies was specific to individual companies — not a broad collapse driven by energy costs. Meta's problems were primarily structural — Apple's App Tracking Transparency framework destroyed Meta's cross-app targeting capability, costing the company approximately $10 billion in revenue. Microsoft's miss was driven by foreign exchange losses from the strong dollar, China supply chain disruptions, and Russia write-downs. Netflix was battling a structural account-sharing problem affecting over 100 million households. Alphabet saw rate-sensitive advertisers in insurance, mortgages, and crypto cutting search budgets. Given their index dominance the 2022 drawdown of roughly 20 percent was largely driven by a technology derating story, not an oil story.
Oil was present in both episodes, but it was not the primary cause in either. In 1973 the oil shock delivered a devastating earnings collapse to an index dominated by energy-intensive industrials. In 2022 the dominant technology sector dragged the index lower for reasons that had almost nothing to do with crude. The index composition, not the oil price, determined the outcome in both cases.
The ASX 300 tells a different story in 2022. The Australian index is dominated by banks and resources — financials represent approximately 35 percent of the index, anchored by Commonwealth Bank, Westpac, NAB and ANZ, and Materials a further 25 percent, led by BHP and Rio Tinto, with Information Technology accounting for only around 3 percent. While the S&P 500 fell approximately 18 percent in 2022 as technology stocks experienced earnings pressure with valuation deratings, the ASX 200 fell only around 1 percent, which is explained almost entirely by index composition. BHP and Rio Tinto held steady as the iron ore price was flat for the year, the major banks held up on strong credit conditions, and the index had little exposure to the technology stocks. Without an earnings collapse in the sectors that dominate the index, there was no bear market.
Implications for 2026
The 2026 crisis differs from its two most damaging predecessors in one important respect: the macro backdrop was considerably more resilient. US and Australian corporate earnings were on an improving and broadening trajectory before the oil shock struck. US manufacturing PMI expanded in February for the first time in three years and maintained momentum into March. Neither condition existed in late 1973, when the economy was already contracting, or in early 2022, when manufacturing activity was rolling over from a post-COVID high. An oil shock that arrives into improving corporate earnings is a very different event from one that compounds a deterioration already underway.
That distinction does not eliminate the risk. For the S&P 500, a sustained Hormuz closure that embeds inflation and forces central banks to raise rates could replicate the 2022 derating scenario for technology stocks. For the ASX 300, the transmission is more indirect. A sustained oil shock would need to collapse commodity prices to undermine earnings of resource companies. On the domestic front, a slowdown would also need to weaken household spending and lift loan arrears to compress bank earnings. Australian households have already proven their resilience on two fronts — the 2022 Ukraine war fuel price spike and the 2023 mortgage refinancing cliff, when a large volume of fixed-rate loans rolled onto materially higher variable rates. Both were expected to substantially reduce household spending and stress bank asset quality. Neither did because the household buffer of scheduled mortgage repayments was extremely high at 21 months at the pandemic peak.
Currently, this buffer has been drawn down to approximately 13 months — still well above the pre-pandemic level of 10 months. Whether a prolonged shock could exhaust it remains the open question.
Conclusion
Geopolitical oil shocks follow a clear pattern for crude prices — but they do not cause equity bear markets on their own. The 1990 Gulf War, the 2003 Iraq invasion and the 2011 Libyan civil war all produced spikes that eventually reversed without a lasting bear market. The two exceptions are not comparable. In 1973 a slowing economy suffered a genuine earnings collapse when oil quadrupled into an index where a large portion of the index were directly exposed to energy costs. In 2022 technology earnings disappointments and a sector derating were the drivers. In neither case was the oil price the primary weapon.
For 2026, the evidence points in a more benign direction than either prior episode. Corporate earnings in both Australia and the US were improving before the shock arrived. The S&P 500 is dominated by sectors with almost no direct relationship to energy costs, and the US reporting season is about to begin — revealing whether that resilience has held through the current crisis.
The oil price will revert, as it always has after every geopolitical oil shock since the 1980s. Whether the economic disruption it leaves behind does the same depends on how long the Strait stays closed — and whether that is long enough to turn an improving earnings environment into a deteriorating one.


Comments